Melee!
Super Smash Bros. Melee for the Nintendo GameCube was released in 2001. Since then, it has become one of the most adored games of the last twenty years. The game features many characters from various Nintendo game franchises, which players choose between before entering a match. The objective of each match is relatively simple: fight your opponent(s) and hit them beyond the boundaries of the stage. In contrast to fighting games, each time a player is struck they gain percentage points. As these percentage points accumulate, each successive attack received sends the player’s character further away and closer to the stage boundaries. Each time a player goes past the stage boundary, they lose a “stock” (i.e. a life). Lose all your stocks and the game is over.
Today, Melee is a popular esport across North America and Europe, where players can watch or enter tournaments with cash prizes. Although the game is simple in premise, mechanically, the game is incredibly complicated and players require a tremendous amount of practice to become a highly skilled at the game.
The best Melee player in the world is Juan “Hungrybox” DeBiedma, currently ranked #1 by a panel of competive players and community figures. Hungrybox plays Jigglypuff, a character originally found in the Pokémon franchise, and he is sponsored by Team Liquid, a high profile esports organization.
His placings in the image below are from the first half of 2018.

Panda Global Rankings Melee: Summer 2018
In late 2017, Hungrybox won five consecutive high level tournaments, much to the chagrin of his opponents and critics. Displeasure over his dominance led to some online discussions of “What should top players do to beat Hungrybox?”.
For context, Fox from the StarFox series is considered to be the best character to use versus Jigglypuff, as he is the best, but also the most technically challenging, character in the game. Fans in turmoil doubted Fox and discussed which alternate characters or strategies might be effective against Hungrybox. These discussions among fans became the subject of ridicule by Leffen, currently ranked #4 in the world, in the following tweet:
i was thinking, what should we do to beat hungrybox? as if it were fate, i came upon this reddit thread.
Now I know exactly what not to do!
— Leffen (@TSM_Leffen) November 7, 2017
Leffen’s tweet features screenshots of fan comments on Reddit that suggest absurd or simplistic strategies that disregard the logic behind high level play. His tweet should speak for itself, but there is a large knowledge gap between fans and top players when it comes to playing against the best player in the world.
The sentiment of Leffen’s tweet is later echoed by Tafo, another community member.
Imagine how many Young Link comments that would show up if I showed this yesterday (Hbox's 2017 char data)
— CLG Tafo (@tafokints) November 7, 2017
Although Tafo’s comments are also made at the expense of fans, he includes a dataset of Hungrybox’s character matchup data for 2017 (against players in the top 50). Tafo effectively highlights a specific misunderstanding that fans have about character matchups in Melee.
The essential sentiment is that fans tend to look past sample size when making inferences on matchup win rates or general performance.
Here is the same data reorganized:
##    OpponentCharacter Wins Losses TotalGames WinPercent
## 1              Marth    7      1          8      87.50
## 2             Samus    12      2         14      85.71
## 3              Sheik   12      2         14      85.71
## 4              Falco    8      2         10      80.00
## 5     Captain Falcon   32     10         42      76.19
## 6              Yoshi    3      1          4      75.00
## 7       Ice Climbers    9      4         13      69.23
## 8            Pikachu    4      2          6      66.67
## 9                Fox  145    104        249      58.23
## 10        Young Link    2      2          4      50.00
Here is where the essential question of this blog post comes in.
Does Hungrybox win more versus Fox than he does versus [Young Link](https://www.ssbwiki.com/Young_Link_(SSBM){target="_blank"}? At face value, the answers seems obvious. Hungrybox wins 58.23% of his matches versus Fox and 50.00% of his matches versus Young Link, so clearly he wins less versus Young Link, right?
In order to make that conclusion, one would have to disregard the sample size or the amount of evidence behind each matchup. Up until 2017/11/07, Hungrybox had won 2/4 matches versus Young Link, whereas he had won 145/249 matches versus Fox. Knowing this, can we confidently say that Hungrybox’s win percentage versus Young Link is truly lower than his win percentage versus Fox?
Thankfully, there is a statistical technique called empirical Bayes estimation that will allow us to predict the proportion of wins in each of Hungrybox’s character matchups. The specific goal of this analysis will be to gain a better estimate of Hungrybox’s win percentage versus Young Link, given the data in Tafo’s tweet. This analysis will allow us to make an informed approximation of which is the best character to use against Hungrybox in high level play.
Before we dive in, I would like to credit David Robinson for his excellent series of posts on Bayesian data analysis. Learning about empirical Bayes estimation through his posts inspired me to use these methods on competitive Melee data.
Set-Up
## data tidying and wrangling
library(dplyr)
library(tidyr)

## visualization
library(ggplot2)
library(ggthemes)
library(RColorBrewer)
library(ggrepel)

## stats
library(MASS)
Import and Arrange Data
Here is the Hungrybox’s matchup data arranged by win percentage in descending order.
Hbox <- read.csv(file = "Hbox2017.csv")

Hbox %>%
  arrange(desc(WinPercent))
## OpponentCharacter Wins Losses TotalGames WinPercent
## 1 Marth 7 1 8 87.50
## 2 Samus 12 2 14 85.71
## 3 Sheik 12 2 14 85.71
## 4 Falco 8 2 10 80.00
## 5 Captain Falcon 32 10 42 76.19
## 6 Yoshi 3 1 4 75.00
## 7 Ice Climbers 9 4 13 69.23
## 8 Pikachu 4 2 6 66.67
## 9 Fox 145 104 249 58.23
## 10 Young Link 2 2 4 50.00
And here is the win percentage data visualized.
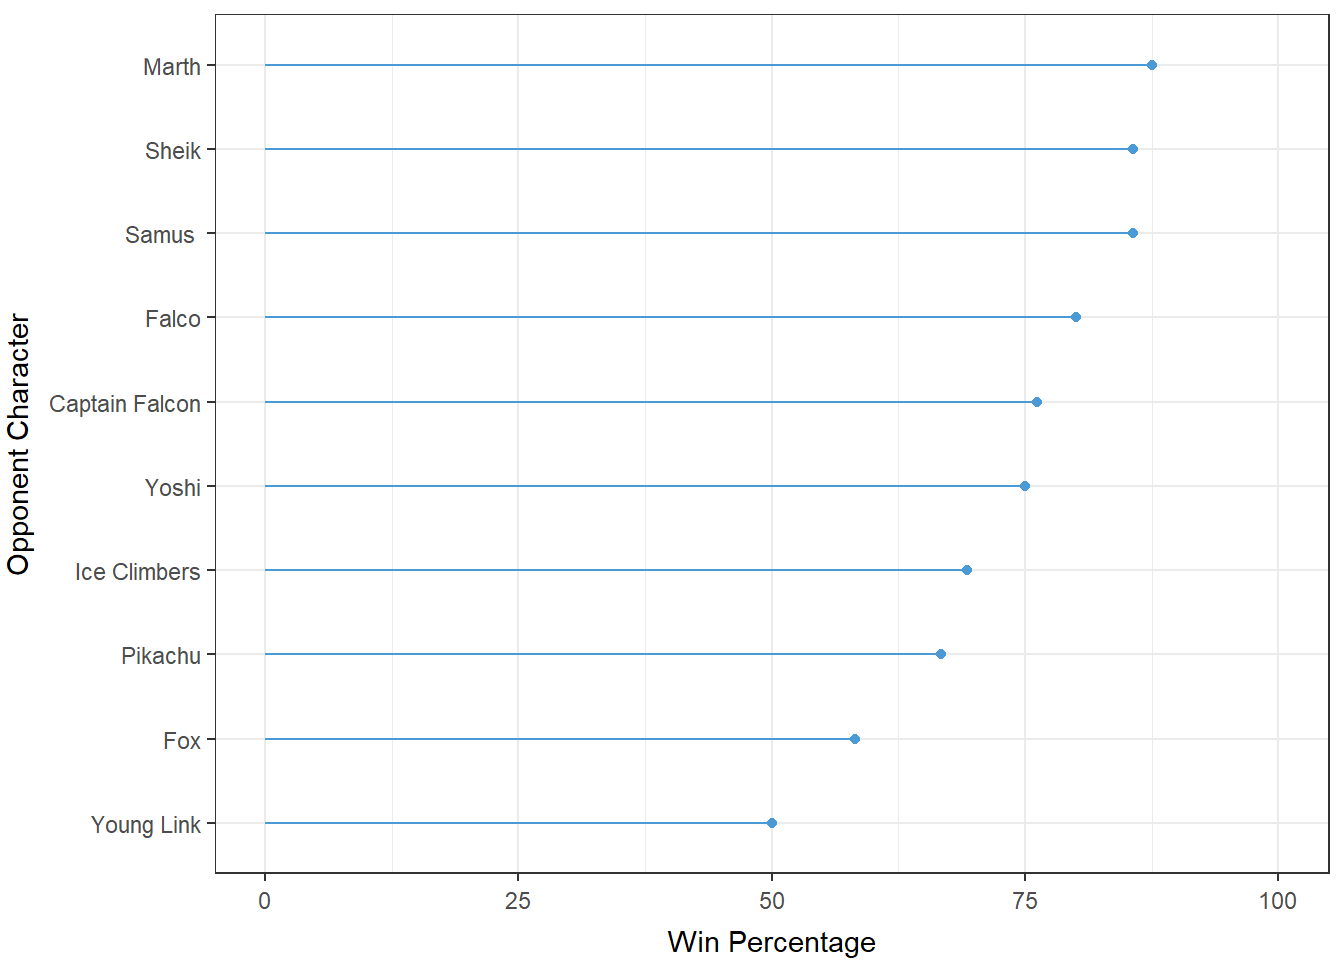
Across the y-axis is the characters of Hungrybox’s opponents and the x-axis is Hungrybox’s win percentage in those matchups at the time of 2017/11/07. Again, the raw data suggest that Hungrybox wins less versus Young Link than versus Fox. My goal is to generate a better approximation of Hungrybox’s win averages across all matchups.
Win Averages
#Calculate win averages
Hbox <- Hbox %>%
  mutate(WinAverage = Wins/TotalGames)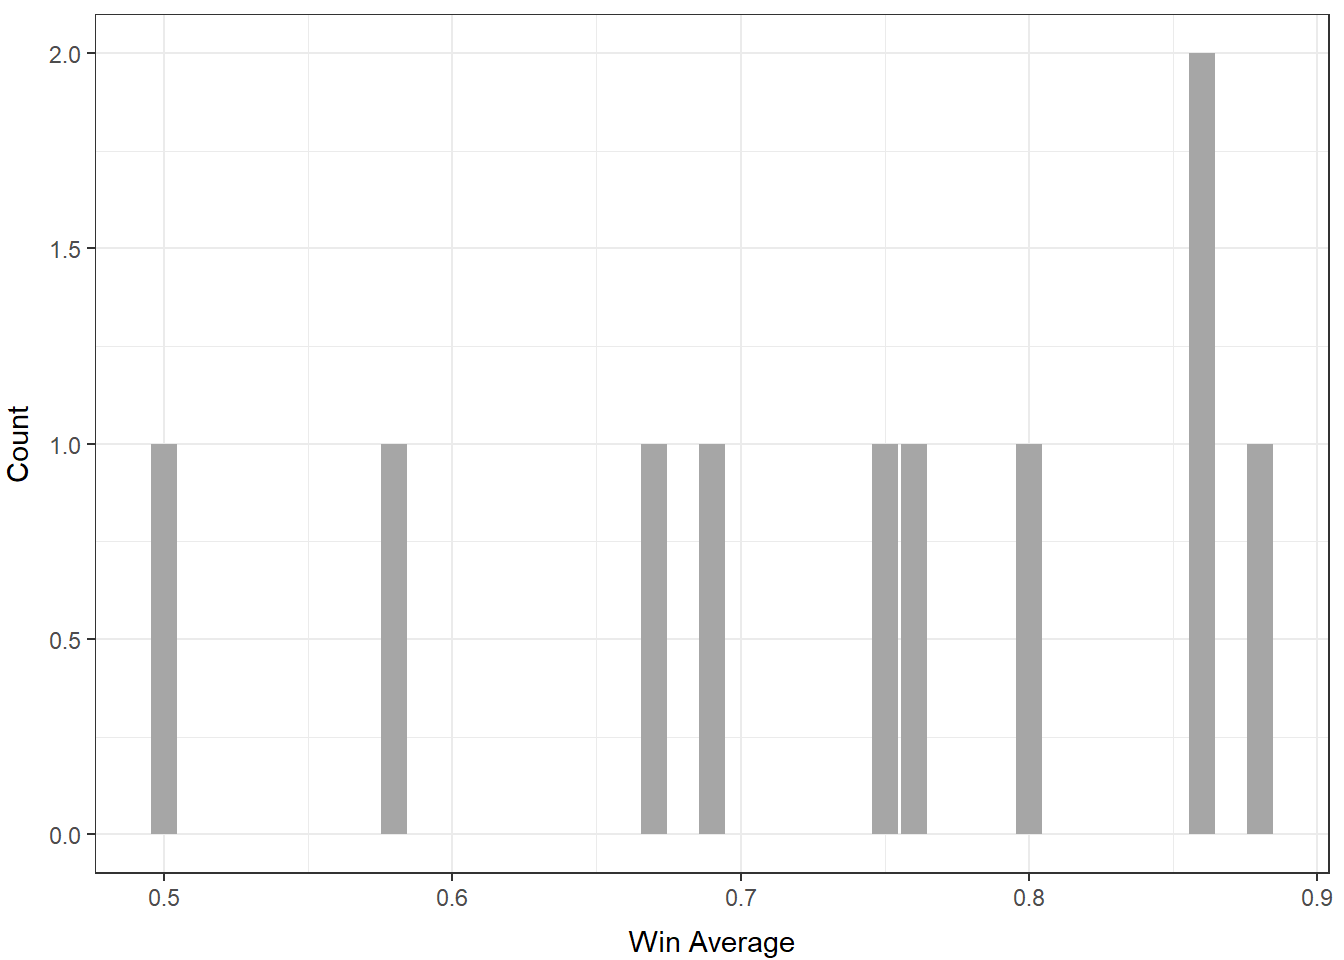
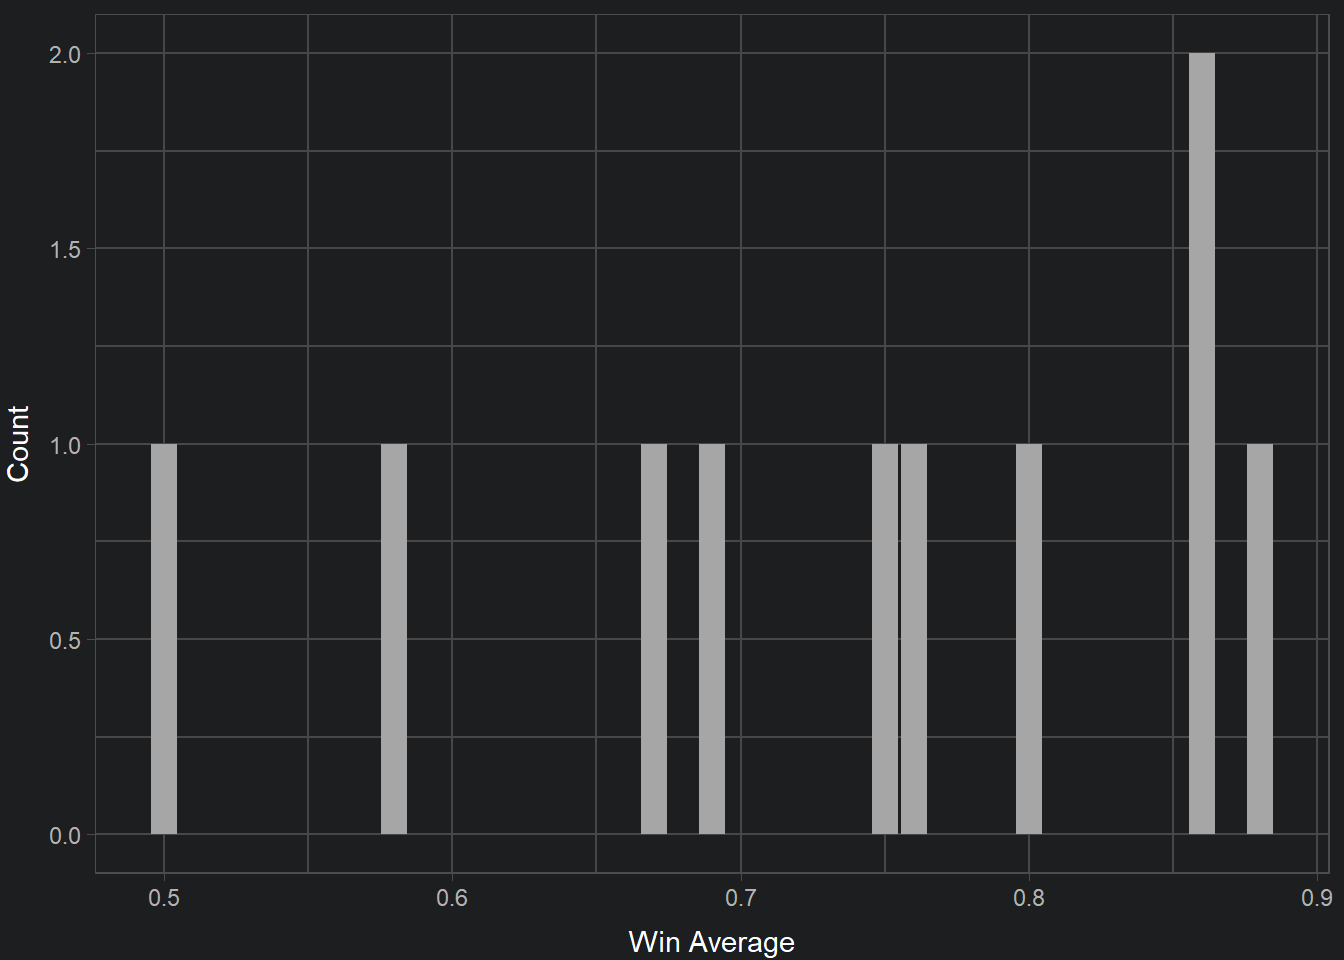
Alternatively, here is a the distribution of win averages across all matchups. This distribution leaves a lot to be desired because it has a small number of observations. This is due to the fact that there are not many characters (out of the 26 possible characters) that are played in high level Melee. Unfortunately, the small amount of data will not yield the strongest approximations of win percentages, but we will continue with what we have.
Prior
For this analysis, we will be relying on the beta distribution and its parameters, alpha and beta, to model the distribution of win averages. Secondly, we will use that distribution to inform new estimates for each of Hungrybox’s character matchups.
First, we must estimate the alpha and beta parameters for the beta distribution. For our purposes, we will use the “method of moments” to estimate the alpha and beta parameters from the mean and variance of our data using this custom function:
estBetaParams <- function(mu, var) {
     alpha <- ((1 - mu) / var - 1 / mu) * mu ^ 2
     beta <- alpha * (1 / mu - 1)
     return(params = list(alpha = alpha, beta = beta))
 }
Credit goes to this Cross Validated user for their insight and function.
So, let’s calculate the mean and variance of Hungrybox’s win averages across all matchups and plug those values into the estBetaParams function.
H.mu <- mean(Hbox$WinAverage)
H.var <- var(Hbox$WinAverage)
Hbox.est <- estBetaParams(H.mu, H.var)
Hbox.est## $alpha
## [1] 8.500409
##
## $beta
## [1] 3.076596
The resulting alpha and beta parameters will inform the shape of our beta distribution (shown in red).
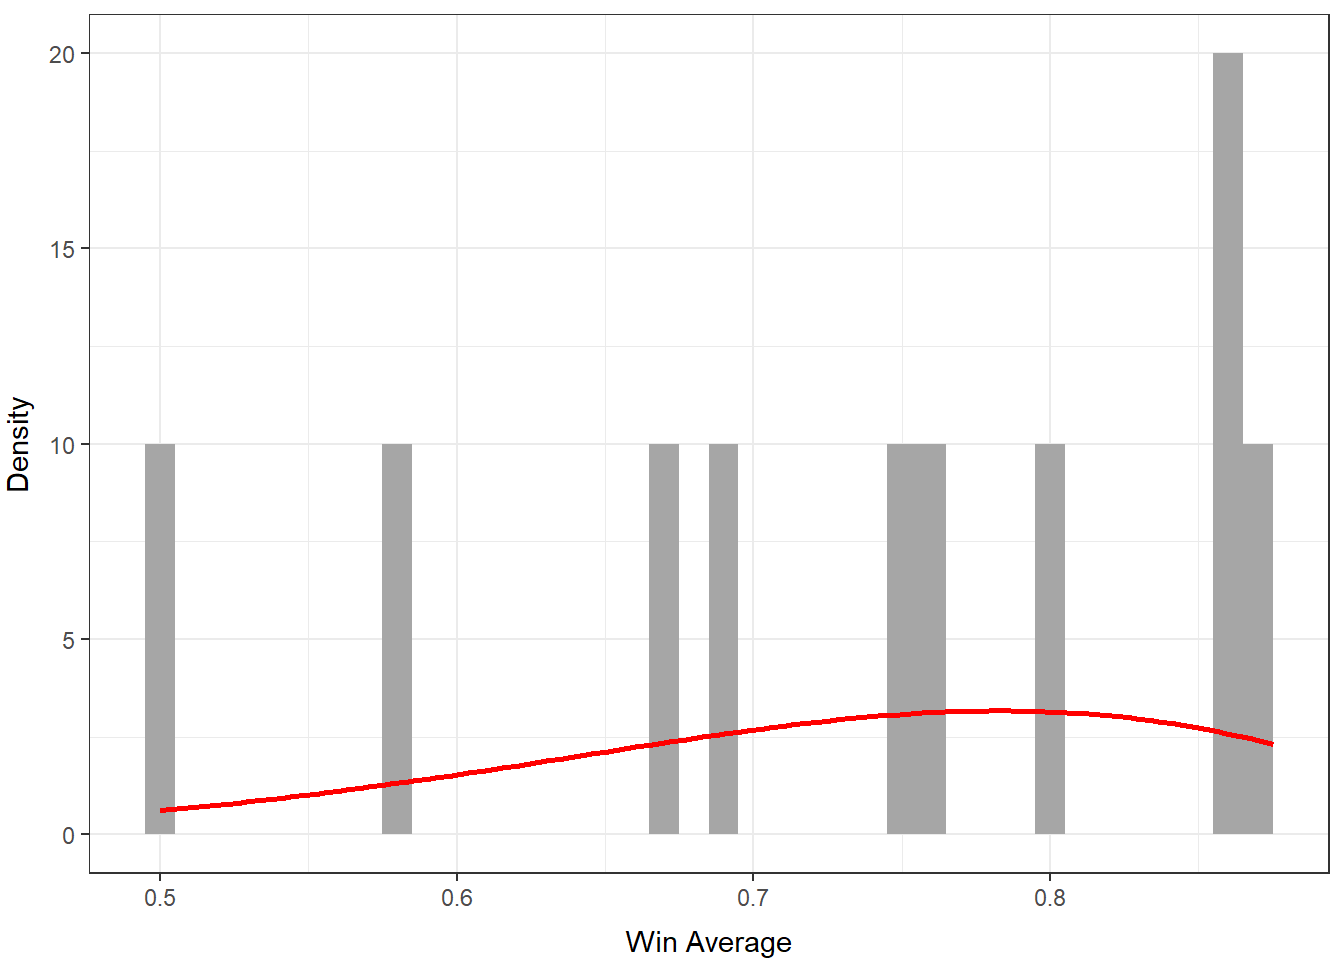
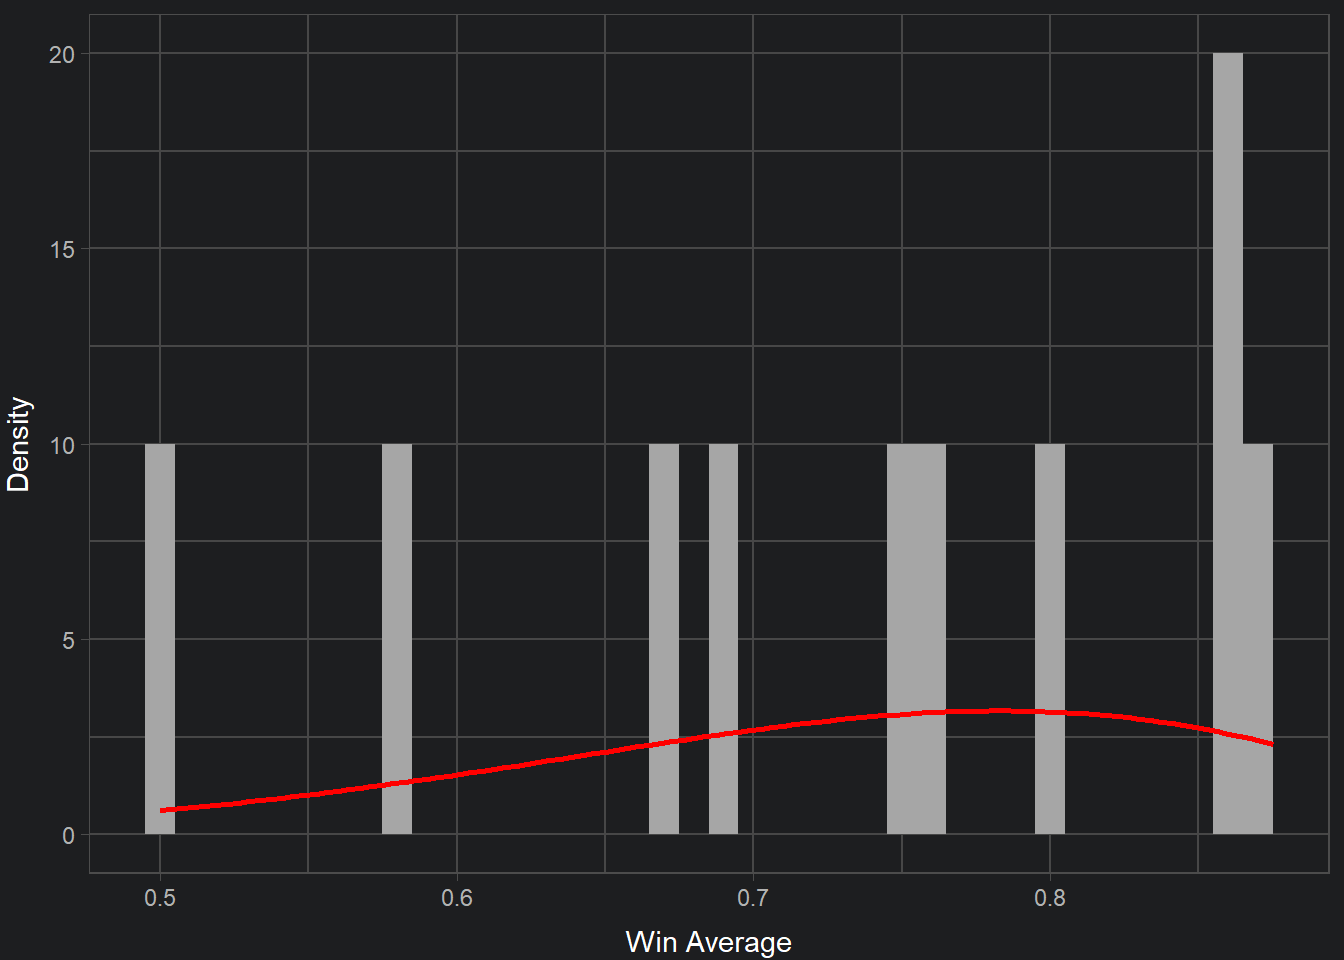
Again, our distribution and number of observations leaves something to be desired. Nonetheless, we will use this distribution to inform our approximations of Hungrybox’s individual character matchups.
To do so, we add alpha and the number of wins in each matchup then divide that by the sum of the total number of games, alpha, and beta.
\[
\frac{Number of Wins + \alpha_0}{Total Number of Games + \alpha_0 + \beta_0}
\]
#How does empirical Bayes estimation change the matchup averages?
Hbox.eb <- Hbox %>%
    mutate(eb_estimate =
             (Wins + Hbox.est$alpha) / (TotalGames + Hbox.est$alpha + Hbox.est$beta))

Hbox.eb %>%
  dplyr::select(-WinPercent) %>%
  arrange(desc(abs(eb_estimate - WinAverage)))
## OpponentCharacter Wins Losses TotalGames WinAverage eb_estimate
## 1 Young Link 2 2 4 0.5000000 0.6740968
## 2 Marth 7 1 8 0.8750000 0.7917661
## 3 Samus 12 2 14 0.8571429 0.8015172
## 4 Sheik 12 2 14 0.8571429 0.8015172
## 5 Pikachu 4 2 6 0.6666667 0.7111797
## 6 Falco 8 2 10 0.8000000 0.7647219
## 7 Ice Climbers 9 4 13 0.6923077 0.7120644
## 8 Yoshi 3 1 4 0.7500000 0.7382940
## 9 Fox 145 104 249 0.5823293 0.5890789
## 10 Captain Falcon 32 10 42 0.7619048 0.7559290The data above have been arranged in descending order by the absolute difference between their new win average estimates and their old win average estimates. Young Link shows the largest change in win percentage between the two estimates, which is interesting considering that we were hoping to improve our estimate of this specific matchup. Alteratively, Hungrybox’s win percentage in the Fox matchup shows one of the smallest differences between the two estimates. This makes sense considering that we have a large amount of data for that specific matchup.
Visualize the changes in win average estimates
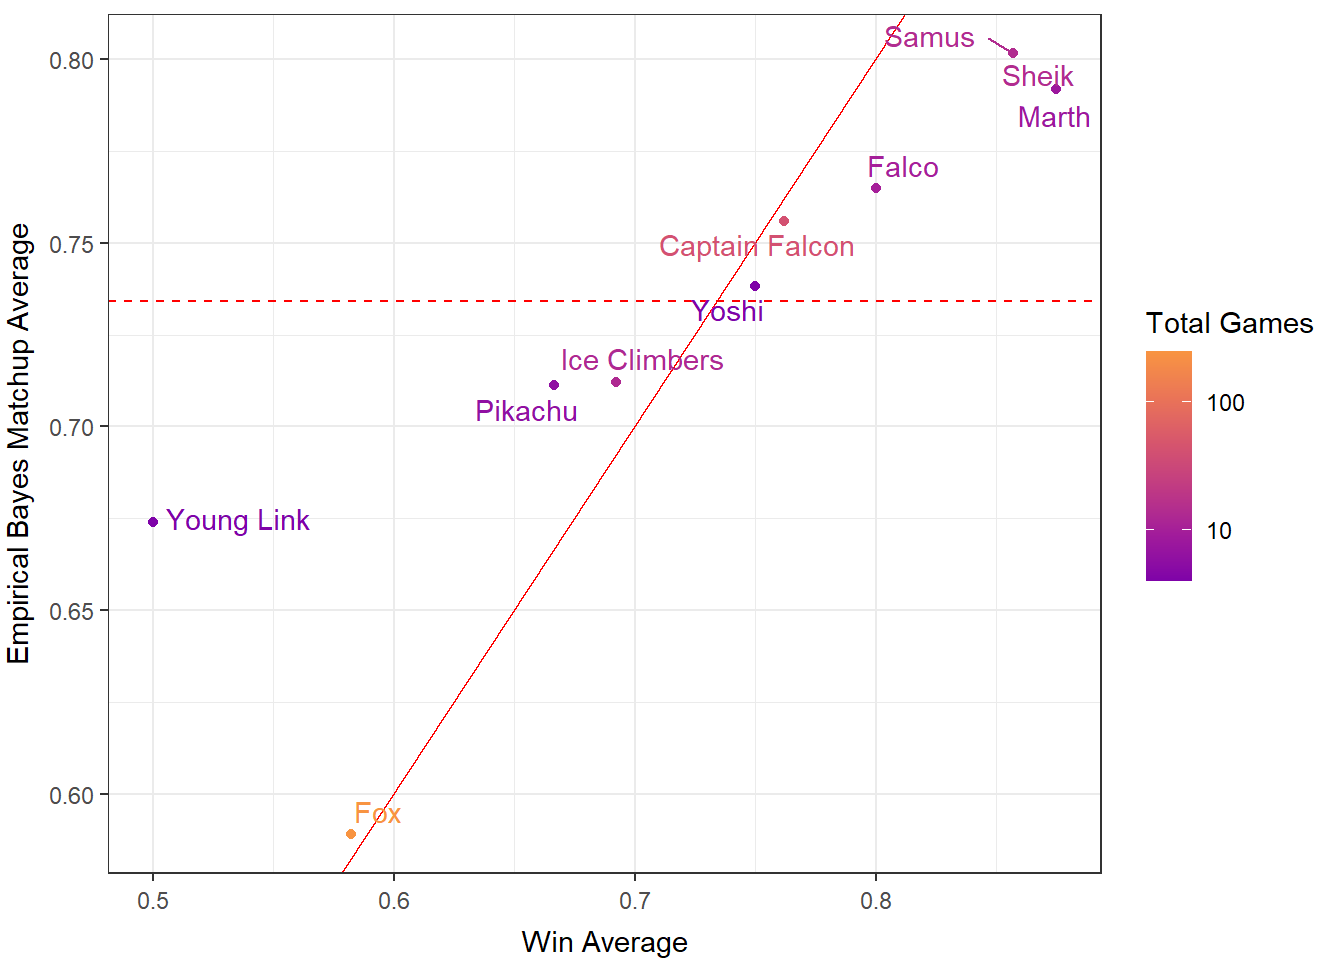
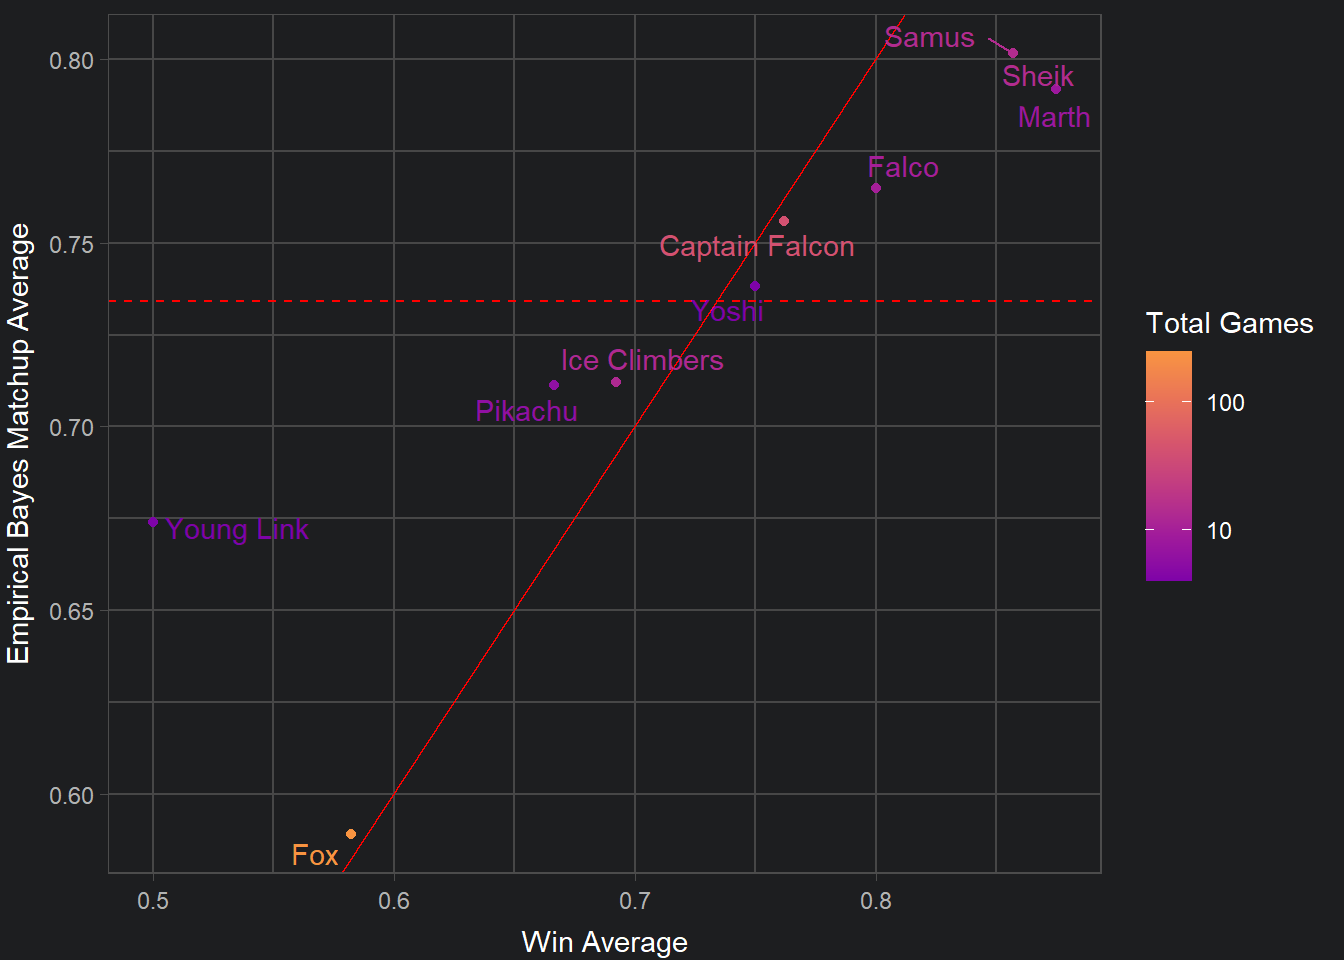
Generally, we can see that as win averages increase, so do the empirical Bayes estimations of the win percentages. We also have two distinct red lines that represent different insights.
The y-intercept of the dashed red line indicates the estimate of Hungrybox’s win average in a matchup given no data. What does this value tell us? Well, what if we had no matchup evidence at all for a matchup? Luigi or Peach are characters that are not included in this dataset. So what would our best estimate of Hungrybox’s win averages versus those characters?
sprintf("%.3f", Hbox.est$alpha / (Hbox.est$alpha + Hbox.est$beta))## [1] "0.734"
Given the data we have, we can estimate Hungrybox’s win average to be 0.734 against characters with no previous evidence. That’s an excellent win rate.
The solid red line indicates where Hungrybox’s win averages are equal to the Bayesian estimates. What this allows us to infer, is the change in estimates. The further away a point lies from the line, the greater change between the original average and the new average. For example, Young Link, Sheik, Marth and Samus show more change in their estimates compared to the other characters.
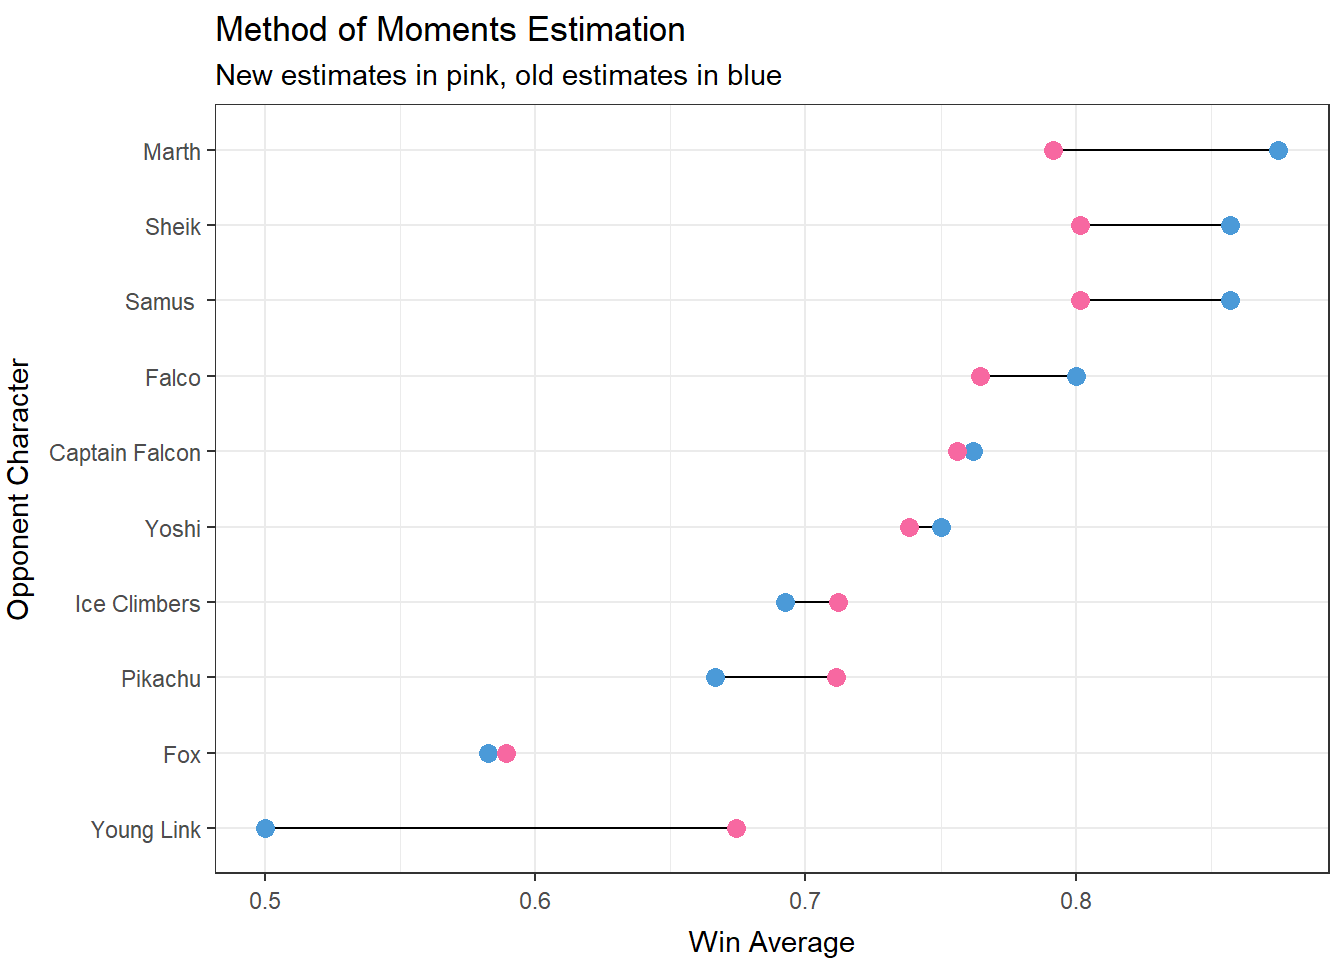
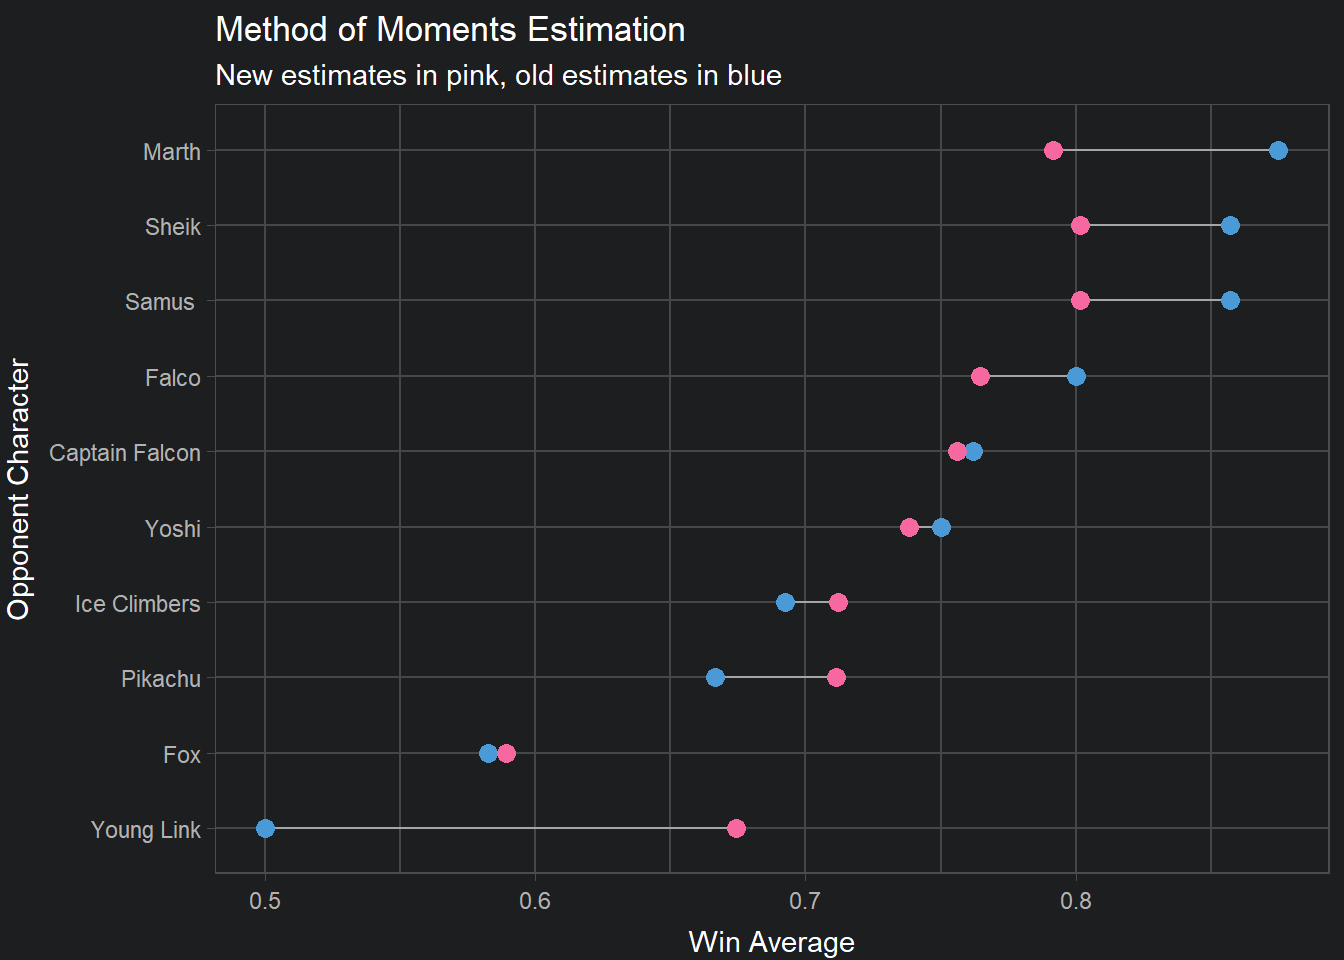
Let’s make a cleveland dot plot to visualize the differences between the new and old win average estimates.
Conclusions
To reiterate, this empirical Bayesian estimation analysis used the distribution of Hungrybox’s win averages across all matchups to improve estimates of win averages in each of Hungrybox’s individual matchups.
So, what did we learn? First we learned that sample size and the number of observations is important. We should not make bold conclusions on percentages or proportions that have a small number of underlying observations. That principle should also be applied to this analysis. Due to the nature of high level competitive Melee, only a few matchups made up Hungrybox’s win average distribution. This affected the estimates of the alpha and beta parameters of the beta distribution, as well as the resulting estimates for each of Hungrybox’s matchups.
With these limitations in mind, this analysis suggests that Young Link is not an optimal character choice versus Hungrybox. In unsurprising fashion, Fox remains Hungrybox’s most difficult matchup, a sentiment believed by Hungrybox, himself. It is an almost natural assumption that the best character in the game would be the hardest to play against, even if you’re #1. Despite the somewhat underwhelming conclusion, the important lesson is that extreme or simplistic solutions should not be applied to complex problems. This statement holds especially true when there is little evidence behind the proposed solution. In order for Young Link to be considered as a legitimate character choice versus Hungrybox, we would require a substantial amount of evidence.
So, does this mean that players should only play Fox against Hungrybox’s Jigglypuff?
Recent tournament results suggest otherwise.
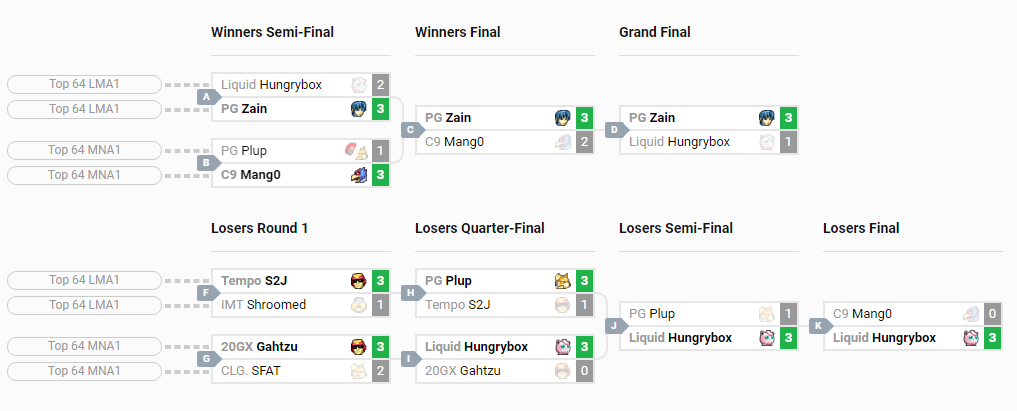
Zain’s astonishing rise through the Melee rankings led him to beat Hungrybox in two best-of-5 tournament matches at Shine 2018. One of those matches was a decisive 3-1 Grand Finals set versus Hungrybox. That feat is compounded by the fact that Zain beat Hungrybox using Marth, a character that historically performs poorly versus Hungrybox’s Jigglypuff. In fact, the last Marth player to beat Hungrybox was PewPewU in 2015. So, character matchups and their estimates are not everything in Melee and that’s just one reason why the competetitive scene can be so exciting to watch.
I am very glad to publish this first post on my blog, especially since I have been sitting on this analysis since Tafo posted the data on Twitter. Taking an analytical stance on one of the many nuances of Melee was very enjoyable for me and I hope you enjoyed reading it. Thanks again to David Robinson for inspiring this post.
If you have any questions or concerns about this blog post, feel free to message me on Twitter or leave a Disqus comment. If you’re interested in competitive Melee, you can watch “The Smash Brothers” documentary, search through competitive Melee VODs, or watch livestreams of tournaments on Twitch. You can use “When’s Melee?” to find out when those tournaments are scheduled.
The code for this post can be found here!
Bonus: Maximum Likelihood Estimation
In addition to estimating the alpha and beta parameters through the method of moments, we can also use maximum likelihood estimation. Here, I use the fitdistr() function from the MASS package to do that with one line of code.
Hbox.est2 <- fitdistr(Hbox$WinAverage,dbeta,list(shape1=1,shape2=1), lower = c(0,0))
Hbox.est2## shape1 shape2
## 10.403528 3.780885
## ( 4.665568) ( 1.625258)
Our estimates of alpha and beta have not changed substantially, but let’s see how this method may have differed in terms of our conclusions.
Maximum Likelihood Estimation
## OpponentCharacter Wins Losses TotalGames WinAverage eb_estimate2
## 1 Young Link 2 2 4 0.5000000 0.6820967
## 2 Marth 7 1 8 0.8750000 0.7844935
## 3 Samus 12 2 14 0.8571429 0.7948907
## 4 Sheik 12 2 14 0.8571429 0.7948907
## 5 Pikachu 4 2 6 0.6666667 0.7135966
## 6 Falco 8 2 10 0.8000000 0.7609665
## 7 Ice Climbers 9 4 13 0.6923077 0.7137740
## 8 Yoshi 3 1 4 0.7500000 0.7370889
## 9 Fox 145 104 249 0.5823293 0.5904739
## 10 Captain Falcon 32 10 42 0.7619048 0.7547205Previous Analysis: Method of Moments
##    OpponentCharacter Wins Losses TotalGames WinAverage eb_estimate
## 1         Young Link    2      2          4  0.5000000   0.6740968
## 2              Marth    7      1          8  0.8750000   0.7917661
## 3             Samus    12      2         14  0.8571429   0.8015172
## 4              Sheik   12      2         14  0.8571429   0.8015172
## 5            Pikachu    4      2          6  0.6666667   0.7111797
## 6              Falco    8      2         10  0.8000000   0.7647219
## 7       Ice Climbers    9      4         13  0.6923077   0.7120644
## 8              Yoshi    3      1          4  0.7500000   0.7382940
## 9                Fox  145    104        249  0.5823293   0.5890789
## 10    Captain Falcon   32     10         42  0.7619048   0.7559290
Again, what if we had no evidence at all for a matchup? What would we predict Hbox’s win average to be in this situation?
Maximum Likelihood Estimation
sprintf("%.3f", Hbox.est2$estimate[1] / (Hbox.est2$estimate[1] + Hbox.est2$estimate[2]))## [1] "0.733"Previous Analysis: Method of Moments
sprintf("%.3f", Hbox.est$alpha / (Hbox.est$alpha + Hbox.est$beta))## [1] "0.734"
And our estimates of win averages?
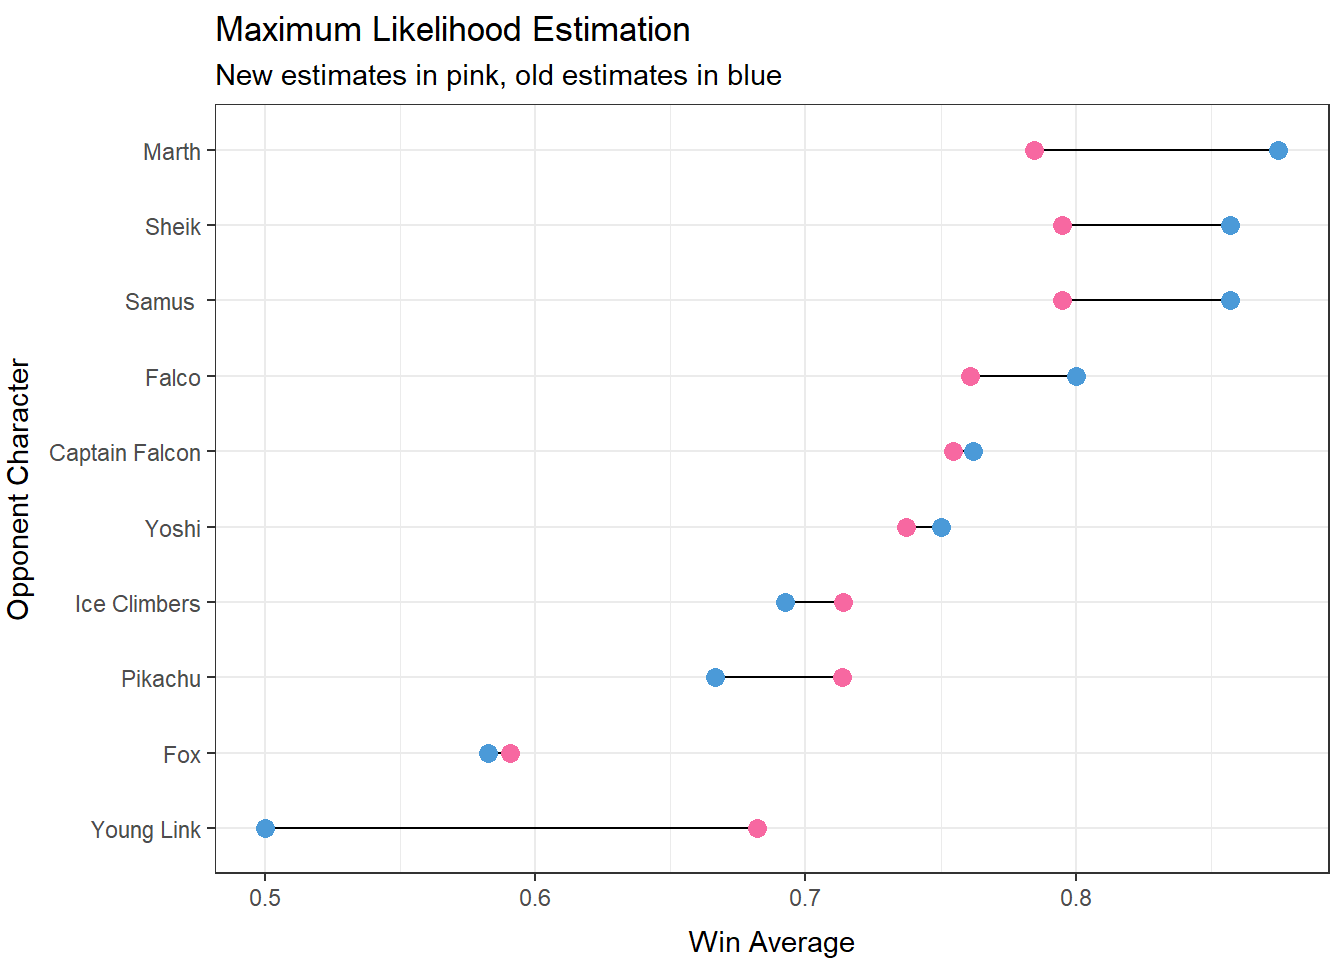

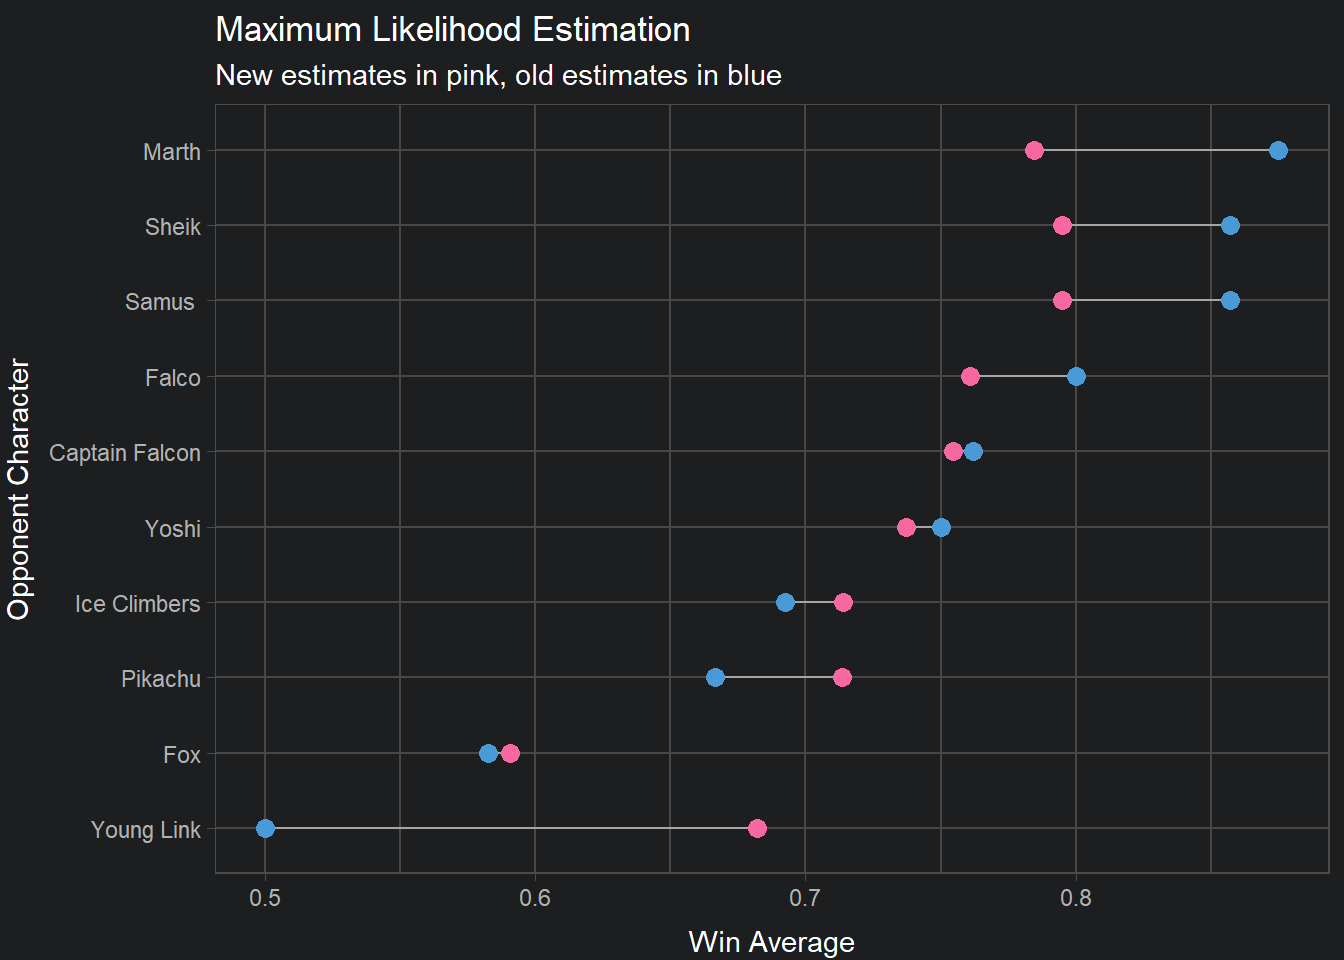

The data do not change very much! It’s nice that this method also reflects the same conclusions as the previous analysis.